Polytropic processes
Code: #123-000
File: apps/ideal_gas/polytropic_processes.ipynb
Run it online: ![]()
The aim of this notebook is to help visualize ploytropic processes for an ideal gas in a \(PV\) diagram.
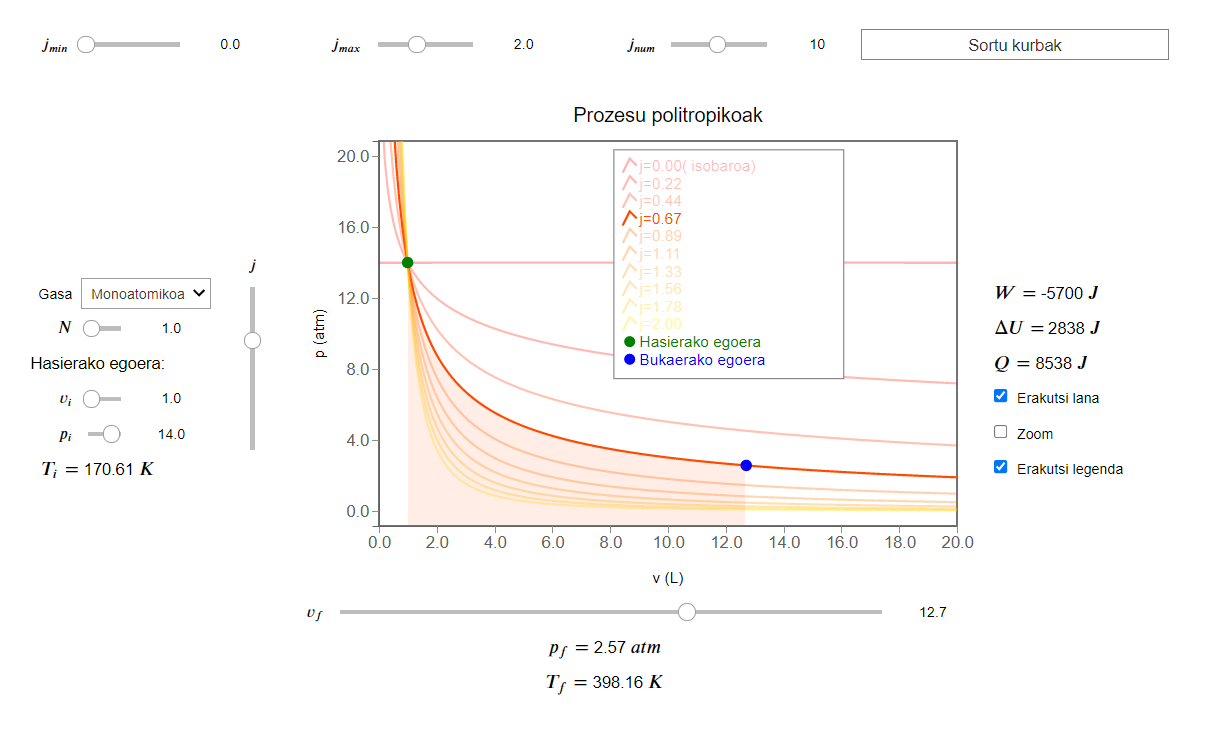
Interface
The main interface (main_block_123_000) is divided in two HBox: top_block_123_000 and body_block_123_000.
top_block_123_000 contains the widgets two generate the polytoripic curves: jmin_slider, jmax_slider, jnum_slider and generate_button.
body_block_123_000 contains three VBox: left_block_123_000, center_block_123_000 and right_block_123_000.
left_block_123_000 contains the widgets to control the input parameters: gamma_dropdown, mol_slider, vi_slider, pi_slider, Ti_text.
center_block_123_000 contains the bqplot figure fig_123_001, the widget to control which curve is selected (j_slider), one input widget (vf_slider) and two output widgets: pf_text and Tf_text.
right_block_123_000 contains the widgets related with energy or visualization: work_text, energy_text, heat_text, show_work, zoom_check and show_legend.
[1]:
from IPython.display import Image
Image(filename='../../static/images/apps/ideal_gas/123-000.png')
[1]:
CSS
A custom css file is used to improve the interface of this application. It can be found here.
[ ]:
from IPython.display import HTML
display(HTML("<head><link rel='stylesheet' type='text/css' href='./../../static/custom.css'></head>"))
display(HTML("<style>.container { width:100% !important; }</style>"))
Packages
[ ]:
import numpy as np

import bqplot as bq
import bqplot.marks as bqm
import bqplot.scales as bqs
import bqplot.axes as bqa

import ipywidgets as widgets
Physical functions
This are the functions that have a physical meaning: - get_process - get_work - get_energy_change - change_mol
[ ]:
def get_process(vi,pi,j):
    '''
    This function calculates the (x,y) points to
    draw a polytropic curve of index j, for an ideall gas.

    Inputs:
    vi: float value for initial point volume
    pi: float value for initial point pressure
    j: polytopic index of the process

    Returns:
    (v_values, p_values) tuple containing:
    v_values: 1d numpy array of len=pts containing the x values of the points
    p_values: 1d numpy array of len=pts containing the y values of the points
    '''


    v_values = np.linspace(v_min, v_max, pts)
    p_values = np.empty((pts))
    for i in range(pts):
        p_values[i] = pi* (vi/v_values[i])**j
        if p_values[i] > 2*p_max:                    # This sentence truncates high y_values to prevent memory overflow
            p_values[i] = 2*p_max

    return v_values, p_values
[ ]:
def get_work(vi, pi, vf, pf, v_values, p_values):
    '''
    This function calculates the work done on the system (positive work)
    or done by the system (negative work), in a process described by the set of points
    (v_value, p_values), that goes from (vi,pi) to (vf,pf). This is accomplished by numerically
    integrating the curve:

    $$W = -\int_{i}^{f} pdV $$

    Inputs:
    vi: float value for initial point volume
    pi: float value for initial point pressure
    vf: float value for final point volume
    pf: float value for final point pressure
    v_values: 1d numpy array of len=pts containing the x values of the points
    p_values: 1d numpy array of len=pts containing the y values of the points


    Returns:
    W = float value for the work done on the system (positive W) or by the system (negative W)
    '''


    W = 0.0
    dv = (v_max - v_min) / pts
    j = 0
    if vf < vi:    # This sentence specifies the direction of integration, and so the sign of W
        vi, vf = vf, vi
        dv = -dv
    for i  in range(pts):
        v = v_values[i]
        p = p_values[i]
        if v > vf:
            break
        elif v > vi:
            W = W - p*dv
    W = C*W    # Convert W form atm*L to J
    return W
[ ]:
def get_energy_change(vi, pi, vf, pf, gamma):
    '''
    This function calculates the change in the energy of an ideal gas
    with adiabatic coefficien gamma tha undergoes a process starting
    on point (vi,pi) and ending on point (vf,pf)

    Inputs:
    vi: float value for initial point volume
    pi: float value for initial point pressure
    vf: float value for final point volume
    pf: float value for final point pressure
    gamma: adiabatic coefficient of the gas
    '''

    Cv = 1.0 / (gamma-1.0) #Adimensional value of Cv (Cv/NR indeed)
    dU = C * Cv*(vf*pf - vi*pi) # Energy difference in Joules
    return dU
[ ]:
def change_mol(change):
    '''
    This function calculates the new temperature values whenever
    the mol value is changed, and calls the update_pT_label() function
    to update is outputed values.
    '''


    # Read widgets
    vi = vi_slider.value
    pi = pi_slider.value
    vf = vf_slider.value
    gamma = gamma_dropdown.value
    j = j_slider.value
    N = mol_slider.value

    # Calculate pT values
    Ti = vi*pi/N/R
    pf = pi* (vi/vf)**j
    Tf = vf*pf/N/R

    # Update output labels
    update_pT_labels(Ti,pf,Tf)
Main interface
[ ]:
#######################
###   PARAMETERS    ###
#######################

## Global Parameters

R = 0.082057 # Ideal gas constant in atm*L/mol/K
C = 101.325 # Conversion factor from atm*L to J -> C = J/atmL
pts = 200 # Number of points for plotting each process


## Limits of parameters (volumes in L, pressures in atm)

# Limits of the figure:
v_min = 0.01
v_max = 20.0
p_min = 0.01
p_max = 20.0

#Limits of the j sliders in the top block
j_lowerbound = 0.0
j_upperbound = 5.0
max_j_num = 20


## Default values

# j values on top block
j_min = 0.0
j_max = 2.0
j_num = 10

# Gas values on left block
vi = 1.0
pi = 14.0
vf = 14.0
gamma = 5.0/3.0 # Adiabatic index (5/3 for monoatomic gases, 7/5 for diatomic gases at room temperature)
N = 1.0 # Number of mols of gas


########################
###CREATE THE FIGURES###
########################

fig_123_001 = bq.Figure(title='Prozesu politropikoak',
                marks=[],
                axes=[],
                padding_x=0.0,
                animation_duration=0,
                legend_location='top-right',
                legend_style= {'fill': 'white', 'stroke': 'grey'},
                background_style= {'fill': 'white',  'stroke': 'black'},
                fig_margin=dict(top=70, bottom=60, left=80, right=30),
                toolbar = True,
                layout=widgets.Layout(width='100%')
    )


scale_x = bqs.LinearScale(min = v_min, max = v_max, allow_padding=False)
scale_y = bqs.LinearScale(min = p_min, max = p_max)

axis_x = bqa.Axis(scale=scale_x,
                tick_format='.1f',#'0.2f',
                tick_style={'font-size': '15px'},
                tick_values = np.linspace(v_min, v_max, 11),
                grid_lines = 'none',
                grid_color = '#8e8e8e',
                label='v (L)',
                label_location='middle',
                label_style={'stroke': 'black', 'default-size': 35},
                label_offset='50px')

axis_y = bqa.Axis(
                scale=scale_y,
                tick_format='.1f',#'0.2f',
                tick_style={'font-size': '15px'},
                tick_values= np.linspace(p_min, p_max, 6),
                grid_lines = 'none',
                grid_color = '#8e8e8e',
                orientation='vertical',
                label='p (atm)',
                label_location='middle',
                label_style={'stroke': 'red', 'default_size': 35},
                label_offset='50px')

fig_123_001.axes = [axis_x,axis_y]


########################
####CREATE THE MARKS####
########################


curves = bqm.Lines(
                x = [],
                y = [],
                scales = {'x': scale_x, 'y': scale_y},
                display_legend=True
)


InitialPoint = bqm.Scatter(
    name = 'Initial Point',
    x = [],
    y = [],
    scales = {'x': scale_x, 'y': scale_y},
    opacities = [1.0],
    visible = True,
    colors = ['green'],
    names = [],
    labels=['Hasierako egoera'],
    display_legend = True
)


FinalPoint = bqm.Scatter(
    name = 'Final Point',
    x = [],
    y = [],
    scales = {'x': scale_x, 'y': scale_y},
    opacities = [1.0],
    visible = True,
    colors = ['blue'],
    names = [],
    labels=['Bukaerako egoera'],
    display_legend = True
)

# Auxiliary curve whose Domine goes from vi to vf, to limit the filled area to that region
fillcurve = bqm.Lines(
                x = [],
                y = [],
                scales = {'x': scale_x, 'y': scale_y},
                opacities = [0.0],
                fill_opacities = [0.0],
                fill = 'bottom',
                display_legend=False
)

fig_123_001.marks = [curves, InitialPoint, FinalPoint, fillcurve]

########################
######  WIDGETS  #######
########################

## Top block (j index values generator block)

jmin_slider = widgets.FloatSlider(
    value=j_min,
    min=j_lowerbound,
    max=j_upperbound,
    step=0.1,
    description='$j_{min}$',
    disabled=False,
    continuous_update=True,
    orientation='horizontal',
    readout=True,
    readout_format='.1f',
    layout=widgets.Layout(width='100%'),
)

jmax_slider = widgets.FloatSlider(
    value=j_max,
    min=j_lowerbound,
    max=j_upperbound,
    step=0.1,
    description='$j_{max}$',
    disabled=False,
    continuous_update=True,
    orientation='horizontal',
    readout=True,
    readout_format='.1f',
    layout=widgets.Layout(width='100%'),
)

jnum_slider = widgets.IntSlider(
    value=j_num,
    min=1,
    max=max_j_num,
    description='$j_{num}$',
    disabled=False,
    continuous_update=True,
    orientation='horizontal',
    readout=True,
    layout=widgets.Layout(width='100%'),
)

generate_button = widgets.Button(
    description='Sortu kurbak',
    disabled=False,
    button_style='', # 'success', 'info', 'warning', 'danger' or ''
    layout=widgets.Layout(width='100%'),
    tooltip='Click me'
)

generate_button.on_click(generate_j_values)


## Left block (Initial state and process block)

gamma_dropdown = widgets.Dropdown(
    options=[('Monoatomikoa',5.0/3.0), ('Diatomikoa',7.0/5.0)],
    value=gamma,
    description='Gasa',
    disabled=False,
    layout=widgets.Layout(width='95%')
)

gamma_dropdown.observe(update_figure, 'value')

mol_slider = widgets.FloatSlider(
    value=1.0,
    min=v_min,
    max=v_max,
    step=0.1,
    description='$N$',
    disabled=False,
    continuous_update=True,
    orientation='horizontal',
    readout=True,
    readout_format='.1f',
    layout=widgets.Layout(width='95%'),
)

mol_slider.observe(change_mol, 'value')


vi_slider = widgets.FloatSlider(
    value=vi,
    min=v_min,
    max=v_max,
    step=0.1,
    description='$v_i$',
    disabled=False,
    continuous_update=True,
    orientation='horizontal',
    readout=True,
    readout_format='.1f',
    layout=widgets.Layout(width='95%'),
)

vi_slider.observe(update_figure, 'value')


pi_slider = widgets.FloatSlider(
    value=pi,
    min=p_min,
    max=p_max,
    step=0.1,
    description='$p_i$',
    disabled=False,
    continuous_update=True,
    orientation='horizontal',
    readout=True,
    readout_format='.1f',
    layout=widgets.Layout(width='95%'),
)

pi_slider.observe(update_figure, 'value')

Ti_text = widgets.Label(value='')


## Center block (figure block)

j_slider = widgets.SelectionSlider(
    options=[0], # This value in non-important as the options list will be updated on execution. But non a empty list must be provided.
    description='$j$',
    disabled=False,
    continuous_update=True,
    orientation='vertical',
    readout=False,  # Readout is currently disabled because it doesn't fit the requiered formmat
    #readout_format='.2f',
    layout = widgets.Layout(width = '%10', height = '80%', margin = '45px 0 0 0')
)

j_slider.observe(update_figure, names='value')


vf_slider = widgets.FloatSlider(
    value=vf,
    min=v_min,
    max=v_max,
    step=0.1,
    description='$v_f$',
    disabled=False,
    continuous_update=True,
    orientation='horizontal',
    readout=True,
    readout_format='.1f',
    layout=widgets.Layout(width='95%'),
)

vf_slider.observe(update_points, 'value')

pf_text = widgets.Label(value='')
Tf_text = widgets.Label(value='')


## Right block (energy block)

work_text = widgets.Label(value='')
energy_text = widgets.Label(value='')
heat_text = widgets.Label(value='')

show_work_check = widgets.Checkbox(
    description='Erakutsi lana',
    disabled=False,
    value=False,
    indent=False,
    layout=widgets.Layout(width='95%')
)

show_work_check.observe(update_fill,'value')

##
zoom_check = widgets.Checkbox(
    description='Zoom',
    disabled=False,
    value=False,
    indent=False,
    layout=widgets.Layout(width='95%')
)

zoom_check.observe(update_zoom,'value')

show_legend_check = widgets.Checkbox(
    description='Erakutsi legenda',
    disabled=False,
    value=True,
    indent=False,
    layout=widgets.Layout(width='95%')
)

show_legend_check.observe(show_legend,'value')

########################
###  INIT FIGURES  ####
########################

generate_j_values(None)


########################
######  LAYOUT  ########
########################

## Top Block ##
top_block_123_000 = widgets.HBox([], layout=widgets.Layout(width='100%', align_items='center'))
top_block_123_000.children = [jmin_slider, jmax_slider, jnum_slider, generate_button]


## Left Block ##
left_block_123_000 = widgets.VBox([], layout=widgets.Layout(width='20%', align_items='center'))
left_block_123_000.children = [gamma_dropdown, mol_slider, widgets.Label(value="Hasierako egoera:"), vi_slider, pi_slider,
                               widgets.HBox([widgets.Label(value='$T_i=$'),Ti_text,widgets.Label(value='$K$')]),
                               ]

## Center Block ##
center_block_123_000 = widgets.VBox([], layout=widgets.Layout(width='65%', align_items='center'))
center_block_123_000.children = [widgets.HBox([j_slider,fig_123_001], layout=widgets.Layout(width='100%', align_items='center')),
                                 vf_slider,
                                 widgets.HBox([widgets.Label(value='$p_f=$'),pf_text,widgets.Label(value='$atm$')]),
                                 widgets.HBox([widgets.Label(value='$T_f=$'),Tf_text,widgets.Label(value='$K$')])
                                ]

## Right Block ##
right_block_123_000 = widgets.VBox([], layout=widgets.Layout(width='15%'))
right_block_123_000.children = [
                                widgets.HBox([widgets.Label(value='$W=$'),work_text,widgets.Label(value='$J$')], layout=widgets.Layout(width='100%')),
                                widgets.HBox([widgets.Label(value='$\Delta U=$'),energy_text,widgets.Label(value='$J$')], layout=widgets.Layout(width='100%')),
                                widgets.HBox([widgets.Label(value='$Q=$'),heat_text,widgets.Label(value='$J$')], layout=widgets.Layout(width='100%')),
                                show_work_check,zoom_check,show_legend_check
                               ]


## Main Block ##

body_block_123_000 = widgets.HBox([],layout=widgets.Layout(width='100%', align_items='center'))
body_block_123_000.children = [left_block_123_000, center_block_123_000,right_block_123_000]

main_block_123_000 = widgets.VBox([],layout=widgets.Layout(width='100%', align_items='center'))
main_block_123_000.children = [top_block_123_000, body_block_123_000]

main_block_123_000