Simple processes
Code: #122-000
File: apps/ideal_gas/simple_processes.ipynb
Run it online: ![]()
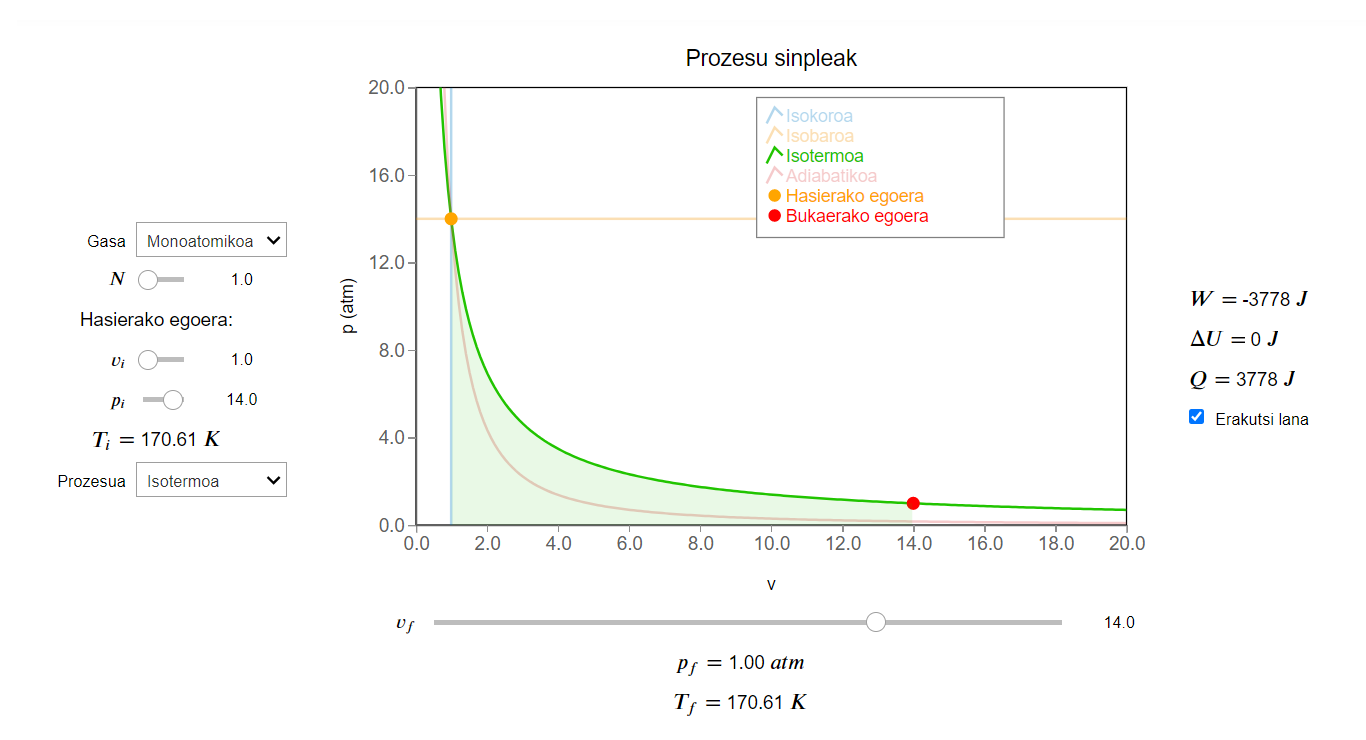
The aim of this notebook is to help visualize the most common processes in a \(PV\) diagram.
Interface
The main interface (main_block_122_000) is divided in three VBox: left_block_122_000, center_block_122_000 and right_block_122_000.
left_block_122_000 contains the following widgets to control the figure: gamma_dropdown, mol_slider, vi_slider, pi_slider, Ti_text and process_dropdown.
center_block_122_000 contains the bqplot figure fig_122_001, the input widget vf_slider and two output widgets: pf_text and Tf_text.
right_block_122_000 contains the widgets related to energy: work_text, energy_text, heat_text and show_work_check.
[1]:
from IPython.display import Image
Image(filename='../../static/images/apps/ideal_gas/122-000.png')
[1]:
The history saving thread hit an unexpected error (DatabaseError('database disk image is malformed')).History will not be written to the database.
CSS
A custom css file is used to improve the interface of this application. It can be found here.
[ ]:
from IPython.display import HTML
display(HTML("<head><link rel='stylesheet' type='text/css' href='./../../static/custom.css'></head>"))
display(HTML("<style>.container { width:100% !important; }</style>"))
Packages
[ ]:
import numpy as np

import bqplot as bq
import bqplot.marks as bqm
import bqplot.scales as bqs
import bqplot.axes as bqa

import ipywidgets as widgets
Physical functions
This are the functions that have a physical meaning:
get_isochoreget_isobarget_isothermget_isenthropicget_pfget_workget_energy_changechange_mol
[ ]:
def get_isochore(vi,pi):
    '''
    This function calculates the (x,y) points to
    draw an isochoric curve for an ideal gas.

    Inputs:
    vi: float value for initial point volume
    pi: float value for initial point pressure

    Returns:
    v_values: 1d numpy array of len=pts containing the x values of the points
    p_values: 1d numpy array of len=pts containing the y values of the points
    '''

    v_values = np.full((pts), vi)
    p_values = np.linspace(p_min,p_max,pts)
    return v_values, p_values
[ ]:
def get_isobar(vi, pi):
    '''
    This function calculates the (x,y) points to
    draw an isobaric curve for an ideal gas.

    Inputs:
    vi: float value for initial point volume
    pi: float value for initial point pressure

    Returns:
    v_values: 1d numpy array of len=pts containing the x values of the points
    p_values: 1d numpy array of len=pts containing the y values of the points
    '''

    v_values = np.linspace(v_min, v_max, pts)
    p_values = np.full((pts), pi)
    return v_values, p_values
[ ]:
def get_isotherm(vi, pi):
    '''
    This function calculates the (x,y) points to
    draw an isothermal curve for an ideal gas.

    Inputs:
    vi: float value for initial point volume
    pi: float value for initial point pressure

    Returns:
    v_values: 1d numpy array of len=pts containing the x values of the points
    p_values: 1d numpy array of len=pts containing the y values of the points
    '''

    v_values = np.linspace(v_min, v_max, pts)
    p_values = np.empty((pts))
    for i in range(pts):
        p_values[i] = pi* vi/v_values[i]
    return v_values, p_values
[ ]:
def get_isenthropic(vi, pi, gamma):
    '''
    This function calculates the (x,y) points to
    draw an isenthropic curve, for an ideall gas with adiabatic coefficient gamma.

    Inputs:
    vi: float value for initial point volume
    pi: float value for initial point pressure
    gamma: adiabatic coefficient of the gas

    Returns:
    v_values: 1d numpy array of len=pts containing the x values of the points
    p_values: 1d numpy array of len=pts containing the y values of the points
    '''

    v_values = np.linspace(v_min, v_max, pts)
    p_values = np.empty((pts))
    for i in range(pts):
        p_values[i] = pi* (vi/v_values[i])**gamma
    return v_values, p_values
[ ]:
def get_pf(vi, pi, vf, gamma, process):
    '''
    This function calculates the final pressure pf for a given process
    starting at point (vi,pi) for a gas with adiabatic coefficient gamma

    Inputs:
    vi: float value for initial point volume
    pi: float value for initial point pressure
    vf: float value for final point volume
    gamma: adiabatic coefficient of the gas
    process: integer index to characterize each process

    Returns:
    x_values: 2d numpy array of dimension (4,pts) with the x_values for each process
    x_values: 2d numpy array of dimension (4,pts) with the y_values for each process
    '''

    if process == 0:
        pf = pf_slider.value
    elif process == 1:
        pf = pi
    elif process == 2:
        pf = pi* vi/vf
    elif process == 3:
        pf = pi* (vi/vf)**gamma
    return pf
[ ]:
def get_work(vi, pi, vf, pf, v_values, p_values):
    '''
    This function calculates the work done on the system (positive work)
    or done by the system (negative work), in a process described by the set of points
    (v_value, p_values), that goes from (vi,pi) to (vf,pf). This is accomplished by numerically
    integrating the curve:

    $$W = -\int_{i}^{f} pdV $$

    Inputs:
    vi: float value for initial point volume
    pi: float value for initial point pressure
    vf: float value for final point volume
    pf: float value for final point pressure
    v_values: 1d numpy array of len=pts containing the x values of the points
    p_values: 1d numpy array of len=pts containing the y values of the points


    Returns:
    W = float value for the work done on the system (positive W) or by the system (negative W)
    '''

    W = 0.0
    dv = (v_max - v_min) / pts
    j = 0
    if vf < vi:
        vi, vf = vf, vi
        dv = -dv
    for i  in range(pts):
        v = v_values[i]
        p = p_values[i]
        if v > vf:
            break
        elif v > vi:
            W = W - p*dv
    W = C*W
    return W
[ ]:
def get_energy_change(vi, pi, vf, pf, gamma):
    '''
    This function calculates the change in the energy of an ideal gas
    with adiabatic coefficien gamma tha undergoes a process starting
    on point (vi,pi) and ending on point (vf,pf)

    Inputs:
    vi: float value for initial point volume
    pi: float value for initial point pressure
    vf: float value for final point volume
    pf: float value for final point pressure
    gamma: adiabatic coefficient of the gas

    '''

    Cv = 1.0 / (gamma-1.0) #Adimensional value of Cv (Cv/NR indeed)
    dU = C * Cv*(vf*pf - vi*pi) # Energy difference in Joules
    return dU
[ ]:
def change_mol(change):
    '''
    This function calculates the new temperature values whenever
    the mol value is changed, and calls the update_pT_label function
    to update is outputed values.
    '''

    vi = vi_slider.value
    pi = pi_slider.value
    vf = vf_slider.value
    gamma = gamma_dropdown.value
    process = process_dropdown.value
    N = mol_slider.value

    Ti = vi*pi/N/R
    pf = get_pf(vi, pi, vf, gamma, process)
    Tf = vf*pf/N/R

    update_pT_labels(Ti,pf,Tf)
Main interface
[ ]:
#######################
###   PARAMETERS    ###
#######################

# Global Parameters
R = 0.082057 # In atm*L/mol/K
C = 101.325 # Conversion factor from atm*L to J -> C = J/atmL

pts = 200 # Number of points for plotting each process

# Limits of parameters (volumes in L, pressures in atm)
v_min = 0.01
v_max = 20.0
p_min = 0.01
p_max = 20.0

# Default values
vi = 1.0
pi = 14.0
vf = 14.0
gamma = 5.0/3.0 # Adiabatic index (5/3 for monoatomic gases, 7/5 for diatomic gases at room temperature)
process = 2 # Index for each process: {0: 'isochoric', 1: 'isobaric', 2: 'isothermal', 3: 'isenthropic' or 'adiabatic'}
N = 1.0 # Number of mols of gas

# Default final state
vf = 14.0

# Figure parameters
colors = ['#0079c4','#f09205','#21c400','#dd4e4f']
isocurves_opacities = [0.3,0.3,1.0,0.3]


#######################
###INIT CALCULATIONS###
#######################

# Pressure and Tempetures
Ti = vi*pi/N/R
pf = get_pf(vi, pi, vf, gamma, process)
Tf = vf*pf/N/R

# Isocurves
(x_values, y_values) = get_marks(vi, pi, gamma)

# Energies
W = get_work(vi, pi, vf, pf, x_values[process], y_values[process])
dU = get_energy_change(vi, vf, pi, pf, gamma)
Q = dU - W


########################
###CREATE THE FIGURES###
########################

fig_122_001 = bq.Figure(title='Prozesu sinpleak',
                marks=[],
                axes=[],
                padding_x = 0.0,
                padding_y = 0.0,
                animation_duration=0,
                legend_location='top-right',
                legend_style= {'fill': 'white', 'stroke': 'grey'},
                background_style= {'fill': 'white',  'stroke': 'black'},
                fig_margin=dict(top=70, bottom=60, left=80, right=30),
                toolbar = True,
                layout=widgets.Layout(width='95%')
    )


scale_x = bqs.LinearScale(min = v_min, max = v_max, allow_padding = False)
scale_y = bqs.LinearScale(min = p_min, max = p_max, allow_padding = False)

axis_x = bqa.Axis(scale=scale_x,
                tick_format='.1f',#'0.2f',
                tick_style={'font-size': '15px'},
                tick_values = np.linspace(v_min, v_max, 11),
                grid_lines = 'none',
                grid_color = '#8e8e8e',
                label='v',
                label_location='middle',
                label_style={'stroke': 'black', 'default-size': 35},
                label_offset='50px')

axis_y = bqa.Axis(
                scale=scale_y,
                tick_format='.1f',#'0.2f',
                tick_style={'font-size': '15px'},
                tick_values= np.linspace(p_min, p_max, 6),
                grid_lines = 'none',
                grid_color = '#8e8e8e',
                orientation='vertical',
                label='p (atm)',
                label_location='middle',
                label_style={'stroke': 'red', 'default_size': 35},
                label_offset='50px')

fig_122_001.axes = [axis_x,axis_y]


########################
####CREATE THE MARKS####
########################


isocurves = bqm.Lines(
                x = x_values,
                y = y_values,
                scales = {'x': scale_x, 'y': scale_y},
                colors = colors,
                opacities = isocurves_opacities,
                #fill_colors = ['green'],
                #fill_opacities = [0.0],
                #fill = 'bottom',
                labels = ['Isokoroa', 'Isobaroa', 'Isotermoa', 'Adiabatikoa'],
                display_legend=True
)


InitialPoint = bqm.Scatter(
    name = 'Initial Point',
    x = [vi],
    y = [pi],
    scales = {'x': scale_x, 'y': scale_y},
    #opacities = [1.0],
    visible = True,
    colors = ['orange'],
    names = [],
    labels=['Hasierako egoera'],
    display_legend = True
)


FinalPoint = bqm.Scatter(
    name = 'Final Point',
    x = [vf],
    y = [pf],
    scales = {'x': scale_x, 'y': scale_y},
    #opacities = [1.0],
    visible = True,
    colors = ['red'],
    names = [],
    labels=['Bukaerako egoera'],
    display_legend = True
)

fillcurve = bqm.Lines(
                x = [],
                y = [],
                scales = {'x': scale_x, 'y': scale_y},
                colors = colors,
                opacities = [0.0],
                fill_colors = [colors[process]],
                fill_opacities = [0.0],
                fill = 'bottom',
                labels = ['Lana'],
                display_legend=False
)

fig_122_001.marks = [isocurves, InitialPoint, FinalPoint, fillcurve]

########################
######  WIDGETS  #######
########################


## Left block (Initial state and process block)

gamma_dropdown = widgets.Dropdown(
    options=[('Monoatomikoa',5.0/3.0), ('Diatomikoa',7.0/5.0)],
    value=gamma,
    description='Gasa',
    disabled=False,
    layout=widgets.Layout(width='95%')
)

gamma_dropdown.observe(update_figure, 'value')

mol_slider = widgets.FloatSlider(
    value=1.0,
    min=v_min,
    max=v_max,
    step=0.1,
    description='$N$',
    disabled=False,
    continuous_update=True,
    orientation='horizontal',
    readout=True,
    readout_format='.1f',
    layout=widgets.Layout(width='95%'),
)

mol_slider.observe(change_mol, 'value')


vi_slider = widgets.FloatSlider(
    value=vi,
    min=v_min,
    max=v_max,
    step=0.1,
    description='$v_i$',
    disabled=False,
    continuous_update=True,
    orientation='horizontal',
    readout=True,
    readout_format='.1f',
    layout=widgets.Layout(width='95%'),
)

vi_slider.observe(update_figure, 'value')


pi_slider = widgets.FloatSlider(
    value=pi,
    min=p_min,
    max=p_max,
    step=0.1,
    description='$p_i$',
    disabled=False,
    continuous_update=True,
    orientation='horizontal',
    readout=True,
    readout_format='.1f',
    layout=widgets.Layout(width='95%')
)

pi_slider.observe(update_figure, 'value')

Ti_text = widgets.Label(value='%.2f' % Ti)


process_dropdown = widgets.Dropdown(
    options=[('Isokoroa',0),('Isobaroa',1), ('Isotermoa',2), ('Adiabatikoa',3)],
    value=2,
    description='Prozesua',
    disabled=False,
    layout=widgets.Layout(width='95%')
)

process_dropdown.observe(change_process, 'value')


## Center block (figure block)

vf_slider = widgets.FloatSlider(
    value=vf,
    min=v_min,
    max=v_max,
    step=0.1,
    description='$v_f$',
    disabled=False,
    continuous_update=True,
    orientation='horizontal',
    readout=True,
    readout_format='.1f',
    layout=widgets.Layout(width='95%'),
)

vf_slider.observe(update_points, 'value')

pf_text = widgets.Label(value='%.2f' % pf)
Tf_text = widgets.Label(value='%.2f' % Tf)

pf_slider = widgets.FloatSlider(
    value=pf,
    min=p_min,
    max=p_max,
    step=0.1,
    description='$p_f$',
    disabled=False,
    continuous_update=True,
    orientation='horizontal',
    readout=True,
    readout_format='.1f',
    layout=widgets.Layout(width='95%'),
)

pf_slider.observe(update_points, 'value')


## Right block (energy block)

work_text = widgets.Label(value='%.0f' % W)
energy_text = widgets.Label(value='%.0f' % dU)
heat_text = widgets.Label(value='%.0f' % Q)

show_work_check = widgets.Checkbox(
    description='Erakutsi lana',
    disabled=False,
    value=False,
    layout=widgets.Layout(width='95%'),
    indent=False
)

show_work_check.observe(update_fill,'value')


########################
######  LAYOUT  ########
########################


## Left Block ##
left_block_122_000 = widgets.VBox([], layout=widgets.Layout(width='20%', align_items='center'))
left_block_122_000.children = [gamma_dropdown, mol_slider, widgets.Label(value="Hasierako egoera:"), vi_slider, pi_slider,
                               widgets.HBox([widgets.Label(value='$T_i=$'),Ti_text,widgets.Label(value='$K$')]),
                               process_dropdown]

## Center Block ##
center_block_122_000 = widgets.VBox([fig_122_001], layout=widgets.Layout(width='65%', align_items='center'))
center_block_122_000.children = [fig_122_001,vf_slider,
                                 widgets.HBox([widgets.Label(value='$p_f=$'),pf_text,widgets.Label(value='$atm$')]),
                                 widgets.HBox([widgets.Label(value='$T_f=$'),Tf_text,widgets.Label(value='$K$')])
                                ]

## Right Block ##
right_block_122_000 = widgets.VBox([], layout=widgets.Layout(width='15%', align_items='flex-start'))
right_block_122_000.children = [
                                widgets.HBox([widgets.Label(value='$W=$'),work_text,widgets.Label(value='$J$')]),
                                widgets.HBox([widgets.Label(value='$\Delta U=$'),energy_text,widgets.Label(value='$J$')]),
                                widgets.HBox([widgets.Label(value='$Q=$'),heat_text,widgets.Label(value='$J$')]),
                                show_work_check
                               ]


## Main Block ##

main_block_122_000 = widgets.HBox([],layout=widgets.Layout(width='100%', align_items='center'))
main_block_122_000.children = [left_block_122_000, center_block_122_000,right_block_122_000]

main_block_122_000