Thermodynamic cycles
Code: #124-000
File: apps/ideal_gas/thermodynamic_cycles.ipynb
Run it online: ![]()
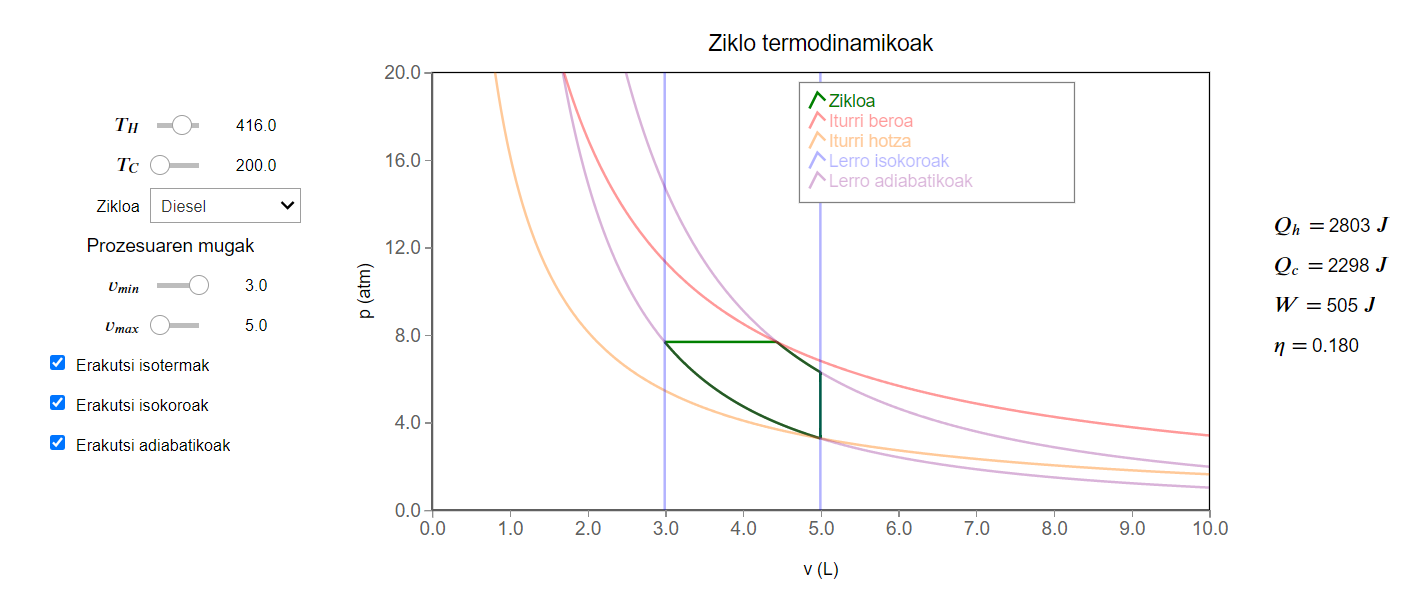
The aim of this notebook is to help visualize the most common cyclic processes for an ideal gas in a \(PV\) diagram.
Interface
The main interface (main_block_124_000) is divided in three VBox: left_block_124_000, center_block_124_000 and right_block_124_000.
left_block_124_000 contains the widgets to control the process: Th_slider, Tc_slider, process_dropdown, volume_text, vi_slider, vf_slider, show_isotherms_check, show_isochores_check and show_adiabatic_check.
center_block_124_000 contains only the bqplot figure fig_124_001.
right_block_124_000 contains the output widgets related to the energy: Qh_text, Qc_text, W_text, and eta_text.
[2]:
from IPython.display import Image
Image(filename='../../static/images/apps/ideal_gas/124-000.png')
[2]:
CSS
A custom css file is used to improve the interface of this application. It can be found here.
[ ]:
from IPython.display import HTML
display(HTML("<head><link rel='stylesheet' type='text/css' href='./../../static/custom.css'></head>"))
display(HTML("<style>.container { width:100% !important; }</style>"))
Packages
[ ]:
import numpy as np

import bqplot as bq
import bqplot.marks as bqm
import bqplot.scales as bqs
import bqplot.axes as bqa

import ipywidgets as widgets
Physical functions
This are the functions that have a physical meaning: - get_vertices_stirling - get_vertices_diesel - get_vertices_carnot - get_path - get_isotherm - get_adiabatic - get_work - get_energy_change
[ ]:
def get_vertices_stirling(Th, Tc, v_max, v_min):
    '''
    This function calculates the four vertices for a Stirling
    cycle between focuses Tc and Th and within volume range
    (v_min,v_max).

    Inputs:
    Th: float value for hot focus temperature (in K)'
    Tc: float value for cold focues temperature (in K)
    v_max: float value for maximun allowed volume (in L)
    v_min: float value for minimun allowed volume (in L)

    Returns:
    v: list of float values for vertex volumes (in L)
    p: list of float values for vertex pressures (in atm)
    '''

    v = [v_max, v_min, v_min, v_max]
    p = [N*R*Tc/v[0], N*R*Tc/v[1], N*R*Th/v[2], N*R*Th/v[3]]
    Cycle_001.possible = True  # Stirling cycles are always possible
    Cycle_001.opacities =[1.0]
    return v, p
[ ]:
def get_vertices_diesel(Th, Tc, v_max, v_min):
    '''
    This function calculates the four vertices for a Diesel
    cycle between focuses Tc and Th and within volume range
    (v_min,v_max). If the process is not possible within the
    given values, it returns a dummy curve and hides the
    cycle plot.

    Inputs:
    Th: float value for hot focus temperature (in K)'
    Tc: float value for cold focues temperature (in K)
    v_max: float value for maximun allowed volume (in L)
    v_min: float value for minimun allowed volume (in L)

    Returns:
    v: list of float values for vertex volumes (in L)
    p: list of float values for vertex pressures (in atm)
    '''

    v = [v_max, v_min, 0.0, v_max]
    p = [N*R*Tc/v[0], 0.0, 0.0, 0.0]

    p[1] = p[0] * (v[0]/v[1])**gamma
    p[2] = p[1]
    v[2] = N*R*Th/p[2]
    p[3] = p[2] * (v[2]/v[3])**gamma
    Cycle_001.possible = True
    Cycle_001.opacities=[1.0]  # Show cycle when possible

    if p[3] > p[2] or p[3] < p[0]:
        # Case: Diesel cycle is impossible within limits
        v=[v_max,v_max,v_min,v_min]
        p=[N*R*Tc/v_max, N*R*Tc/v_max, N*R*Th/v_min, N*R*Th/v_min]
        Cycle_001.possible = False
        Cycle_001.opacities=[0.0]  # Hide cycle when impossible

    return v, p
[ ]:
def get_vertices_carnot(Th, Tc, v_max, v_min):
    '''
    This function calculates the four vertices for a Carnot
    cycle between focuses Tc and Th and within volume range
    (v_min,v_max). If the process is not possible within the
    given values, it returns a dummy curve and hides the
    cycle plot.

    Inputs:
    Th: float value for hot focus temperature (in K)'
    Tc: float value for cold focues temperature (in K)
    v_max: float value for maximun allowed volume (in L)
    v_min: float value for minimun allowed volume (in L)

    Returns:
    v: list of float values for vertex volumes (in L)
    p: list of float values for vertex pressures (in atm)
    '''

    v = [v_max, 0.0, v_min, 0.0]
    p = [N*R*Tc/v[0], 0.0, N*R*Th/v[2], 0.0]

    v[1] = (v[2]**gamma/v[0] * p[2]/p[0])**(1.0/(gamma-1.0))
    p[1] = N*R*Tc/v[1]
    v[3] = (v[0]**gamma/v[2] * p[0]/p[2])**(1.0/(gamma-1.0))
    p[3] = N*R*Th/v[3]
    Cycle_001.possible = True
    Cycle_001.opacities=[1.0]  # Show cycle when possible

    if v[0] <= v[1]:
        # Case: Carnot cycle is impossible within limits
        v = [v_max, v_max, v_min, v_min]
        p = [N*R*Tc/v_max, N*R*Tc/v_max, N*R*Th/v_min, N*R*Th/v_min]
        Cycle_001.possible = False
        Cycle_001.opacities=[0.0]  # Hide cycle when impossible

    return v, p
[ ]:
def get_path(vi,pi,vf,pf):
    '''
    This function calculates a polytropic path between
    to given points in a pv plane.

    Inputs:
    vi: float value for initial point volume (in L)
    pi: float value for initial point pressure (in atm)
    vf: float value for final point volume (in L)
    pf: float value for final point pressure (in atm)

    Returns:
    v_values: 1darray with float values for volumes (in L)
    p_values: 1darray with float values for pressures (in atm)
    '''

    v_values = np.linspace(vi,vf,pts)
    p_values = np.empty((pts))

    if abs(vf-vi) < 0.01:  # Isochoric case
        p_values = np.linspace(pi,pf,pts)
    else:
        j = np.log(pi/pf)/np.log(vf/vi)
        for i in range(pts):
            p_values[i] = pi * (vi/v_values[i])**j

    return v_values, p_values
[ ]:
def get_isotherm(T):
    '''
    This function calculates the (v,p) coordinates
    for a isotherm with termperature T.

    Inputs:
    T: float values for temperature (in K)

    Returns:
    v_values: 1darray with float values for volumes (in L)
    p_values: 1darray with float values for pressures (in atm)
    '''

    v_values = np.linspace(v_min, v_max, pts)
    p_values = np.empty((pts))

    for i in range(pts):
        p_values[i]  = N*R*T/v_values[i]

    return v_values, p_values
[ ]:
def get_adiabatic(vi,pi):
    '''
    This function calculates the (v,p) coordinates
    for a adiabatic curve that passes through point
    (vi,pi)

    Inputs:
    vi: float value for given point volume (in L)
    pi: float value for given point pressure (in atm)

    Returns:
    v_values: 1darray with float values for volumes (in L)
    p_values: 1darray with float values for pressures (in atm)
    '''

    v_values = np.linspace(v_min,v_max,pts)
    p_values = np.empty((pts))

    for i in range(pts):
        p_values[i] = pi * (vi/v_values[i])**gamma

    return v_values, p_values
[ ]:
def get_work(v_values, p_values):
    '''
    This function calculates the work done in a process
    described by the point arrays v_values, p_values by
    applying numerical integration.

    Inputs:
    v_values: 1darray with the v coordinates of the curve (in L)
    p_values: 1darray with the p coordinates of the curve (in atm)

    Returns:
    W: float value for the work done (in J)
    '''

    W = 0.0
    dv = (v_values[pts-1] - v_values[0]) / pts
    for i  in range(pts):
        v = v_values[i]
        p = p_values[i]
        W = W - p*dv
    W = C*W    # Convert W form atm*L to J
    return W
[ ]:
def get_energy_change(vi, pi, vf, pf, gamma):
    '''
    This function calculates the internal energy change of a process
    starting at (vi,pi) and ending at (vf,pf).

    Inputs:
    vi: float value for initial point volume (in L)
    pi: float value for initial point pressure (in atm)
    vf: float value for final point volume (in L)
    pf: float value for final point pressure (in atm)

    Returns
    dU: float value for the energy change (in J)
    '''

    Cv = 1.0 / (gamma-1.0) #Adimensional value of Cv (Cv/NR indeed)
    dU = C * Cv*(vf*pf - vi*pi) # Energy difference in Joules
    return dU
Main interface
[ ]:
#######################
###   PARAMETERS    ###
#######################

## Global Parameters

N = 1.0
R = 0.082057 # Ideal gas constant in atm*L/mol/K
C = 101.325 # Conversion factor from atm*L to J -> C = J/atmL
pts = 1000 # Number of points for plotting each process
gamma = 5.0/3.0 # Adiabatic index. For a monoatomic gas: 5/3

## Limits of parameters (volumes in L, pressures in atm)

# Limits of the figure
v_min = 0.01
v_max = 10.0
p_min = 0.01
p_max = 20.0

# Limits of the sliders
Th_min = 300.0
Th_max = 500.0
Tc_min = 200.0
Tc_max = 300.0
v_min_lowerbound = 1.0
v_min_upperbound = 3.0
v_max_lowerbound = 5.0
v_max_upperbound = 8.0

# Initial values
vi = 3.0
vf = 5.0
Tc = 200.0
Th = 400.0
gamma = 5.0/3.0 # Adiabatic index (5/3 for monoatomic gases, 7/5 for diatomic gases at room temperature)
N = 1.0 # Number of mols of gas

########################
###CREATE THE FIGURES###
########################

fig_124_001 = bq.Figure(title='Ziklo termodinamikoak',
                marks=[],
                axes=[],
                padding_x=0.0,
                padding_y=0.0,
                animation_duration=0,
                legend_location='top-right',
                legend_style= {'fill': 'white', 'stroke': 'grey'},
                background_style= {'fill': 'white',  'stroke': 'black'},
                fig_margin=dict(top=70, bottom=60, left=80, right=30),
                toolbar = True,
                layout=widgets.Layout(width='95%')
    )


scale_x = bqs.LinearScale(min = v_min, max = v_max, allow_padding = False)
scale_y = bqs.LinearScale(min = p_min, max = p_max, allow_padding = False)

axis_x = bqa.Axis(scale=scale_x,
                tick_format='.1f',#'0.2f',
                tick_style={'font-size': '15px'},
                tick_values = np.linspace(v_min, v_max, 11),
                grid_lines = 'none',
                grid_color = '#8e8e8e',
                label='v (L)',
                label_location='middle',
                label_style={'stroke': 'black', 'default-size': 35},
                label_offset='50px')

axis_y = bqa.Axis(
                scale=scale_y,
                tick_format='.1f',#'0.2f',
                tick_style={'font-size': '15px'},
                tick_values= np.linspace(p_min, p_max, 6),
                grid_lines = 'none',
                grid_color = '#8e8e8e',
                orientation='vertical',
                label='p (atm)',
                label_location='middle',
                label_style={'stroke': 'red', 'default_size': 35},
                label_offset='50px')

fig_124_001.axes = [axis_x,axis_y]

########################
####CREATE THE MARKS####
########################

Cycle_001 = bqm.Lines(
                x = [],
                y = [],
                scales = {'x': scale_x, 'y': scale_y},
                display_legend=False,
                colors = ['green'],
                possible = True,
)

CycleLegend_001 = bqm.Lines(
                x = [],
                y = [],
                scales = {'x': scale_x, 'y': scale_y},
                display_legend=True,
                colors = ['green'],
                labels=['Zikloa'],
)

Isotherms_001 = bqm.Lines(
                x = [],
                y = [],
                scales = {'x': scale_x, 'y': scale_y},
                display_legend=True,
                labels = ["Iturri beroa", "Iturri hotza"],
                colors = ['#FF0000', '#FF7700'],
                opacities = [0.4]
)

IsochoreMin_001 = bqm.Lines(
                x = [],
                y = [],
                scales = {'x': scale_x, 'y': scale_y},
                display_legend=True,
                labels = ["Lerro isokoroak"],
                colors = ['blue'],
                opacities = [0.3],
)

IsochoreMax_001 = bqm.Lines(
                x = [],
                y = [],
                scales = {'x': scale_x, 'y': scale_y},
                display_legend=False,
                colors = ['blue'],
                opacities = [0.3],
)

AdiabaticMin_001 = bqm.Lines(
                x = [],
                y = [],
                scales = {'x': scale_x, 'y': scale_y},
                display_legend=True,
                labels = ["Lerro adiabatikoak"],
                colors = ['purple'],
                opacities = [0.3],
)

AdiabaticMax_001 = bqm.Lines(
                x = [],
                y = [],
                scales = {'x': scale_x, 'y': scale_y},
                display_legend=False,
                colors = ['purple'],
                opacities = [0.3],
)


fig_124_001.marks = [Cycle_001, CycleLegend_001, Isotherms_001, IsochoreMin_001, IsochoreMax_001, AdiabaticMin_001, AdiabaticMax_001]

########################
######  WIDGETS  #######
########################

Th_slider = widgets.FloatSlider(
    value=Th,
    min=Th_min,
    max=Th_max,
    step=2,
    description='$T_H$',
    disabled=False,
    continuous_update=True,
    orientation='horizontal',
    readout=True,
    readout_format='.1f',
    layout=widgets.Layout(width='95%'),
)

Th_slider.observe(update_isotherms, 'value')

Tc_slider = widgets.FloatSlider(
    value=Tc,
    min=Tc_min,
    max=Tc_max,
    step=2,
    description='$T_C$',
    disabled=False,
    continuous_update=True,
    orientation='horizontal',
    readout=True,
    readout_format='.1f',
    layout=widgets.Layout(width='95%'),
)

Tc_slider.observe(update_isotherms, 'value')

process_dropdown = widgets.Dropdown(
    options=['Stirling', 'Diesel', 'Carnot'],
    value='Stirling',
    description='Zikloa',
    disabled=False,
    layout=widgets.Layout(width='95%')
)

process_dropdown.observe(update_points, 'value')


vi_slider = widgets.FloatSlider(
    value=vi,
    min=v_min_lowerbound,
    max=v_min_upperbound,
    step=0.1,
    description='$v_{min}$',
    disabled=False,
    continuous_update=True,
    orientation='horizontal',
    readout=True,
    readout_format='.1f',
    layout=widgets.Layout(width='95%'),
)

vi_slider.observe(update_points, 'value')

vf_slider = widgets.FloatSlider(
    value=vf,
    min=v_max_lowerbound,
    max=v_max_upperbound,
    step=0.1,
    description='$v_{max}$',
    disabled=False,
    continuous_update=True,
    orientation='horizontal',
    readout=True,
    readout_format='.1f',
    layout=widgets.Layout(width='95%'),
)

vf_slider.observe(update_points, 'value')

show_isotherms_check = widgets.Checkbox(
    description='Erakutsi isotermak',
    disabled=False,
    value=True,
    layout=widgets.Layout(width='95%')
)

show_isotherms_check.observe(show_isocurves, 'value')

show_isochores_check = widgets.Checkbox(
    description='Erakutsi isokoroak',
    disabled=False,
    value=True,
    layout=widgets.Layout(width='95%')
)

show_isochores_check.observe(show_isocurves, 'value')

show_adiabatics_check = widgets.Checkbox(
    description='Erakutsi adiabatikoak',
    disabled=False,
    value=True,
    layout=widgets.Layout(width='95%')
)

show_adiabatics_check.observe(show_isocurves, 'value')


########################
######  LABELS  ########
########################

Qh_text = widgets.Label(value='')
Qc_text = widgets.Label(value='')
W_text = widgets.Label(value='')
eta_text = widgets.Label(value='')
volume_text = widgets.Label(value='')


########################
######   INIT   ########
########################

update_isotherms(None)


########################
######  LAYOUT  ########
########################


# Left Block ##
left_block_124_000 = widgets.VBox([], layout=widgets.Layout(width='20%', align_items='center'))
left_block_124_000.children = [Th_slider, Tc_slider, process_dropdown, volume_text, vi_slider, vf_slider,
                               show_isotherms_check, show_isochores_check, show_adiabatics_check]

## Center Block ##
center_block_124_000 = widgets.VBox([], layout=widgets.Layout(width='70%', align_items='center'))
center_block_124_000.children = [fig_124_001]

## Right Block ##
right_block_124_000 = widgets.VBox([], layout=widgets.Layout(width='10%', align_items='center'))
right_block_124_000.children = [
                                widgets.HBox([widgets.Label(value='$Q_h=$'),Qh_text,widgets.Label(value='$J$')], layout=widgets.Layout(width='100%')),
                                widgets.HBox([widgets.Label(value='$Q_c=$'),Qc_text,widgets.Label(value='$J$')], layout=widgets.Layout(width='100%')),
                                widgets.HBox([widgets.Label(value='$W=$'),W_text,widgets.Label(value='$J$')], layout=widgets.Layout(width='100%')),
                                widgets.HBox([widgets.Label(value='$\eta =$'),eta_text], layout=widgets.Layout(width='100%'))
                               ]

## Main Block ##

main_block_124_000 = widgets.HBox([],layout=widgets.Layout(width='100%', align_items='center'))
main_block_124_000.children = [left_block_124_000, center_block_124_000, right_block_124_000]

main_block_124_000